We’ve shared frameworks for thinking about how to reduce Scope 1 and Scope 2 emissions, but what about the complex world of Scope 3? The broadest scope of emissions, Scope 3 encompasses all emissions within your value chain. These include upstream emissions – like products and services you purchase, business travel and employee commuting, and waste generated in operations – as well as downstream emissions – like transportation of goods, investments, and how your sold products are ultimately used.
That indirect nature can make these emissions harder to measure. You’re another step removed from the source. But for many organizations, Scope 3 makes up the lion’s share of their emissions – 75 percent of total emissions on average across all sectors, according the CDP. So in the path to net zero, you need to be able to recognize your Scope 3 impact, prioritize reduction opportunities, and take action with partners across your value chain.
Step 1: Identify your data sources for Scope 3 emissions
Before you can put together a reduction plan, you’ll need to understand the sources of your emissions data. It’s more straightforward to collect primary data for some of the fifteen Scope 3 categories than others. For example, businesses typically have a better record of employee travel than they do how customers use their product after purchase. The reality is that you’ll likely need a mix of primary and modeled data to get a complete picture, and you’ll need to work across your organization (and even beyond) to get the data you need.
Examples of Scope 3 data sources:
- [Category 1] Purchased goods and services: Procurement and accounting teams, external suppliers
- [Category 5] Waste generated in operations: Facilities and real estate teams
- [Category 7] Employee commute: Employee surveys and/or estimation parameters
It’s important to keep track of the type of data you gather for each Scope 3 category. Primary or granular modeled data is going to be more actionable than commodity type averages, so wherever possible, try to get specific data straight from the source.
Why is primary data more actionable? Imagine your organization purchased a certain volume of paper for its offices last year. You could calculate your organization’s Scope 3 emissions from paper purchasing using a commodity type average – an academic average emissions value for every dollar spent. That methodology will help you determine your overall emissions output, and can help you identify whether certain offices or business units are responsible for more emissions than others. When it comes time to reduce, though, the only concrete step is to reduce your spending in the category. Without a supplier-level or product-level view of emissions, you’re not able to identify other levers for change, like prioritizing more efficient suppliers or less emissions-intensive paper products.
Step 2: Identify emissions hotspots
Ideally, your emissions calculations should not only provide an overall view of your emissions responsibility, but also a map of “emissions hotspots.” These are specific Scope 3 categories, locations, or business units that are responsible for an outsized portion of your emissions output.
You can identify hotspots in a few ways. You can look at absolute emissions numbers – which category makes up the largest number of emissions? Within a Scope 3 category, it can also be helpful to normalize the data to your business – for example, looking at emissions per spend for specific suppliers (Purchased Goods and Services), or emissions per revenue for specific product lines (Use of Sold Product).
Step 3: Determine emissions reduction levers
The last piece of the puzzle is understanding where you can best drive action, in the short and long term. Just as it can be harder to measure Scope 3 emissions when you don’t own the data within your organization, it can also be harder to drive reductions when you’re influencing behavior or decisions outside of your team or company.
In some categories it can be easier to drive action than in others. Look for the categories where you or your organization hold influence or power. For example, large corporations have buying power with their suppliers; investors have investing power with their portfolio companies and other assets; and employers have policy-making power to influence business travel.
Other categories, like end-of-life treatment or use of sold product, can be trickier to control. You may not have as much direct influence on how your customers use or dispose of your product, but you do have the power to develop, prioritize, or promote products with lower emissions impact in their use or disposal.
Step 4: Map it all together and prioritize!
You now have the three critical components to understand your opportunities and prioritize action. We often map these on a quadrant:
- Data actionability (Y-axis): How granular is your data source for this category? Did you use primary or secondary data?
- Mitigation opportunity (X-axis): How much power do you/your organization hold in driving emissions reductions?
- Relative carbon impact (size of bubble): What categories make up the largest portions of your Scope 3 emissions?
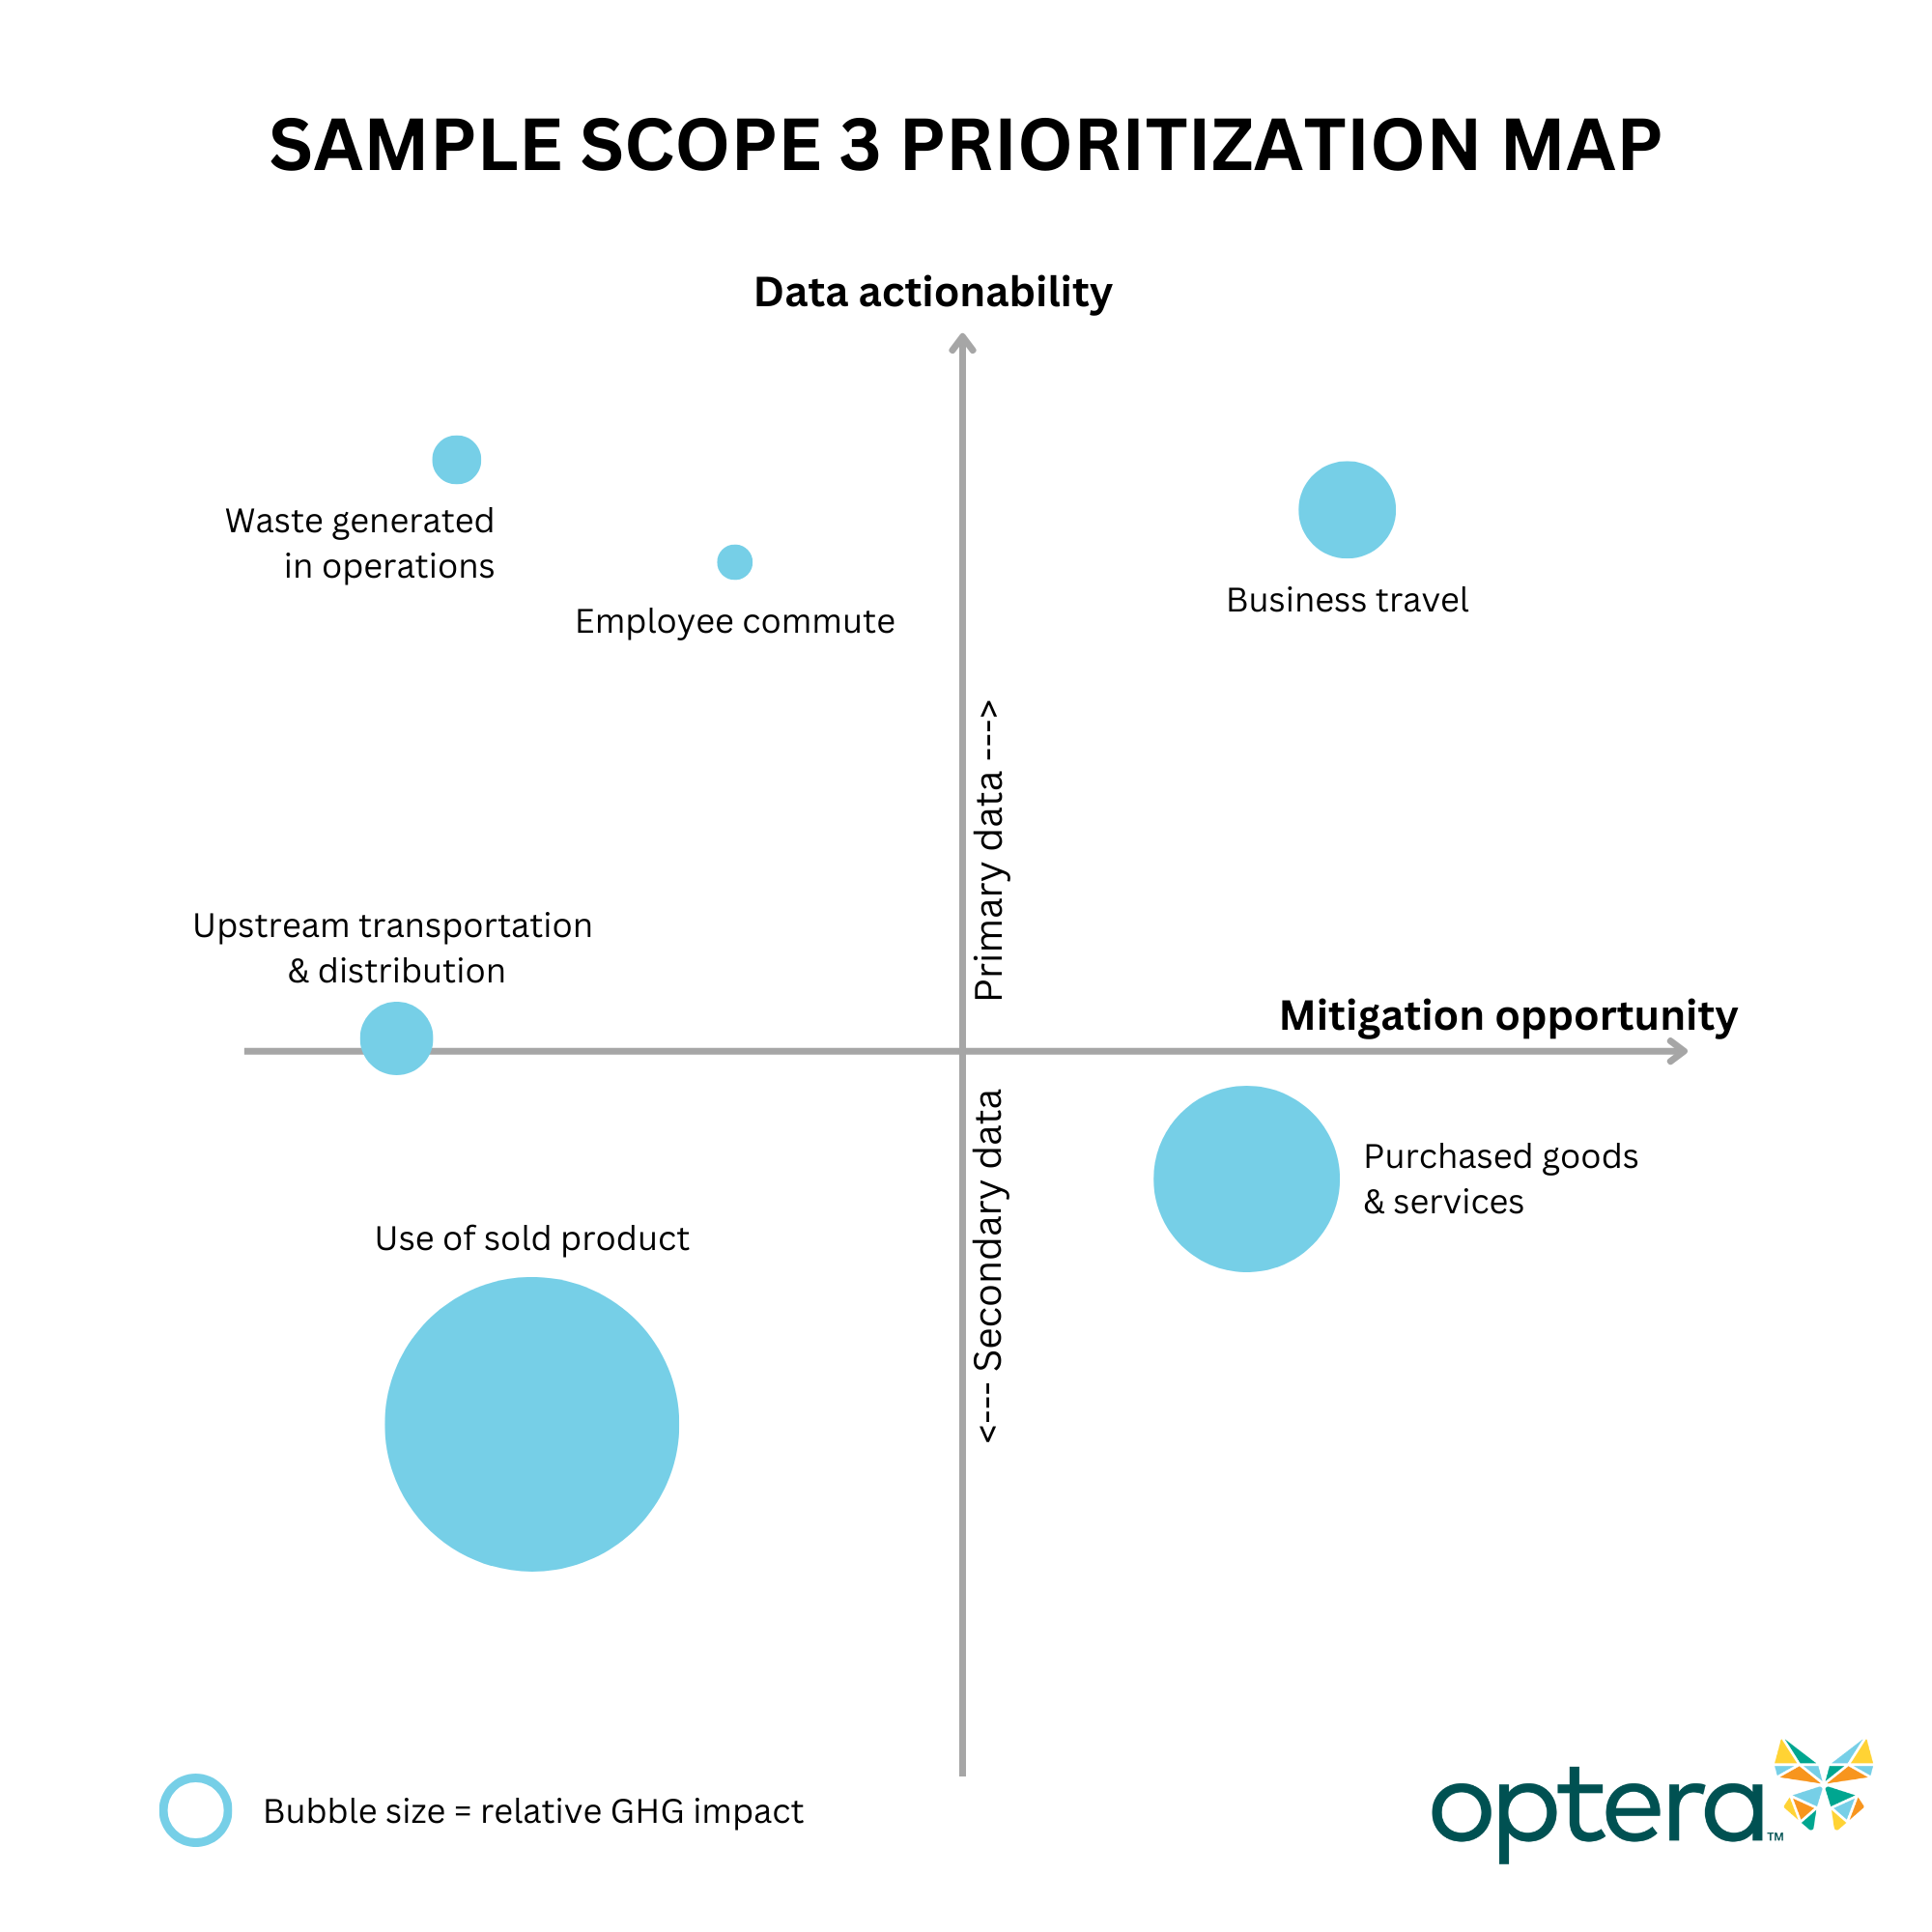
Categories mapped to the top right are highly actionable – these are the places you can likely drive the most immediate impact. Look for the biggest hotspots within these categories and dive in to make changes this year.
Categories in the bottom right are actionable, but you may not have the granular data you need to prioritize efforts. For hotspots in this category, start building the relationships you need to get more primary data, but don’t let a lack of perfect data get in the way of taking action where you can in the short term.
Categories on the left are places where you may have the data to pinpoint the problem, but you have less power in driving a solution. If you have hotspots in this category, it can be helpful to collaborate with other organizations in your industry or value chain to scale data collection, learn best practices, and drive action together. Organizations like the Responsible Business Alliance are facilitating this kind of collaboration across entire industries and supply chains.
Getting started
Data sources, hotspots, and actionability are going to vary for every industry and organization. This article offers one framework for making a seemingly overwhelming problem more manageable. But if you don’t have the capacity or resources to conduct this analysis for all Scope 3 categories, don’t give up. You don’t need perfect data to get started diving into one or two categories that you know are likely big-emissions categories for your business. As is the theme for this entire series, the most important thing? Get started.
Other articles in this series:
4 Steps to reduce your scope 1 emissions